transition Statistics
In the Greater Philadelphia region, there is a significant percentage of youth enrolled in various non-traditional/out-of-home care facilities relative to the number of youth who live in traditional family environments. Further, the percentages of these troubled youth who transition to responsible career or educational paths is alarmingly low. The percentages of youth from both traditional as well as non-traditional care environments is explored below and compared against rates associated with school drop-outs, the homeless, and the incarcerated.
Dependent Care Transitions
Positive vs. Negative
Family Type |
Negative Path* |
Responsible Living Path** |
Traditional Family |
7% |
93% |
Non-Traditional Family |
89% |
11% |
*Negative Path is defined as a transition from structured dependent care to a troubled situation including school drop out, homelessness, and incarceration.
**Responsible Living Path is defined as a transition a situation of gainful employment and independent status.
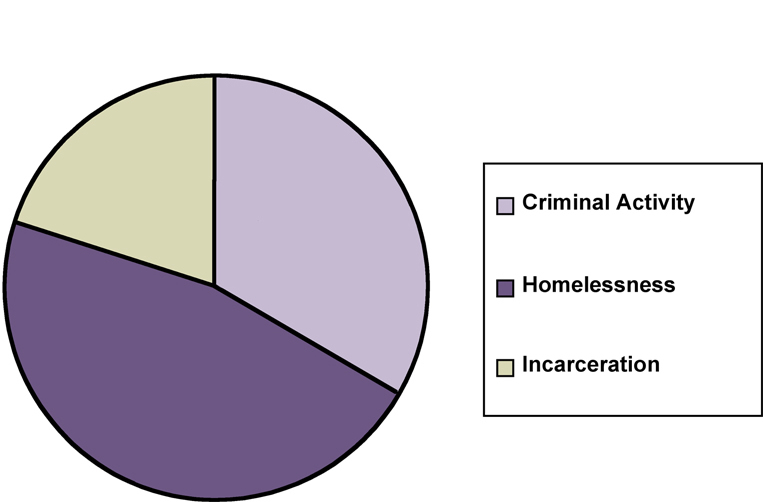
Negative Breakdown
Family Type |
Drop Out Rate |
Homeless Rate |
Incarceration Rate |
Other |
Traditional Family |
58% |
.04% |
.02% |
51% |
Non-Traditional Family |
40% |
10% |
30% |
20% |
Back to Top
Drop Out Statistics
|
-
Every nine seconds of every school day, on average, a student becomes a dropout.
-
There were 3.5 million dropouts ages 16 to 24 in 2005, accounting for about 9 percent of that age group.
-
Three-quarters of state prison inmates and 59 percent of federal inmates are high school dropouts.
-
Every 600,000 who drop out in any given year cost public health-insurance programs $23 billion.
-
Crime-related costs would drop $1.4 billion if 1 percent of male dropouts ages 20 to 60 finished high school.
-
Federal investment in second-chance education and training programs have fallen from $15 billion in the late 1970s to $3 billion today, adjusted for inflation.
SOURCE: Study data compiled by the American Youth Policy Forum; U.S. Department of Education; Peter Muennig, Mailman School of Public Health, Columbia University
|
Philadelphia Drop-Outs |
- 8,278 dropouts from 2003 to 2004
- An average of 46 students per day
- Loss in region income: Over $2 billion
- Loss in tax revenue: Over $500,000
- Loss in individual income for dropouts compared to graduates: $260,000
- Loss in individual taxes: Over $60,000
Sources: 1) Ruth Curran Neild and Robert Balfanz, Unfulfilled Promise: The Dimensions and Characteristics of Philadelphia’s Dropout Crisis, 2000-2005 cited in A Collective Effort to Understand and Resolve the Philadelphia Dropout Crisis, Project U-Turn, 2006; 2) Cecelia Rouse, National Study Princeton University (individual income & tax stats).
|
Back to Top
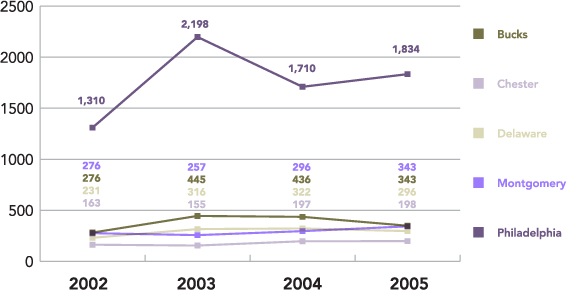
Youth Placement Trends

Back to Top
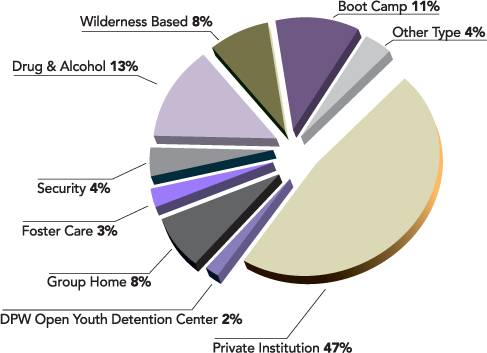
Youth Placement Type

Back to Top
Mentoring Research
 |
Research has demonstrated that adolescents with at least one high-quality supportive relationship with an adult are twice as likely as other youth to be economically self-sufficient, have healthy family and social relationships, and be productively involved in their communities (Gambone, Klem, & Connell, 2002). |
 |
Unfortunately, at-risk youth and youthful offenders often have limited contact with positive adult role models with whom they can form and sustain meaningful relationships (Jones-Brown & Henriques, 1997). |
 |
Mentoring programs can provide the opportunity for troubled youth to establish supportive relationships with positive adult role models (Office of Juvenile Justice Delinquency Program, 2000). |
 |
Delinquent youth have lower educational aspirations and are more likely to drop out of school than their non-delinquent peers. Furthermore, once they enter the labor market, formerly delinquent youth tend to get less prestigious jobs and are more likely to be fired. Finally, if these youth get married, they are more likely to divorce. (Tanner, Davies, O’Grady, 1999). |
 |
Mentored youth, especially minority males, had improved relationships with peers (Grossman & Garry, 1997).
|
Back to Top
Economic Impact of Transitions:
 |


